
VDA5 Prestudy Tutorial
When to use this tool
Before conducting a full VDA5 Measurement System Analysis (MSA), it is essential to perform a VDA5 Prestudy. This preliminary evaluation ensures your measurement system is stable, suitable, and ready for a detailed uncertainty assessment. The prestudy acts as a screening tool to detect obvious issues with repeatability, reproducibility, or resolution before investing time and resources into the full analysis.
In the context of the VDA5 Standard, the prestudy helps verify that:
- The measurement equipment is capable of detecting variation between parts
- The operators and instruments perform consistently
- The system meets the basic requirements for resolution and statistical behavior
Using EngineRoom
To use the tool, in the DMAIC menu select Measure > Measurement System Analysis (MSA)... > VDA5 > VDA5 Prestudy (In the Standard menu, select the tool under Quality Tools > VDA5). The study opens on the workspace:
There is one required hexagons or 'drop zones' attached to the study:
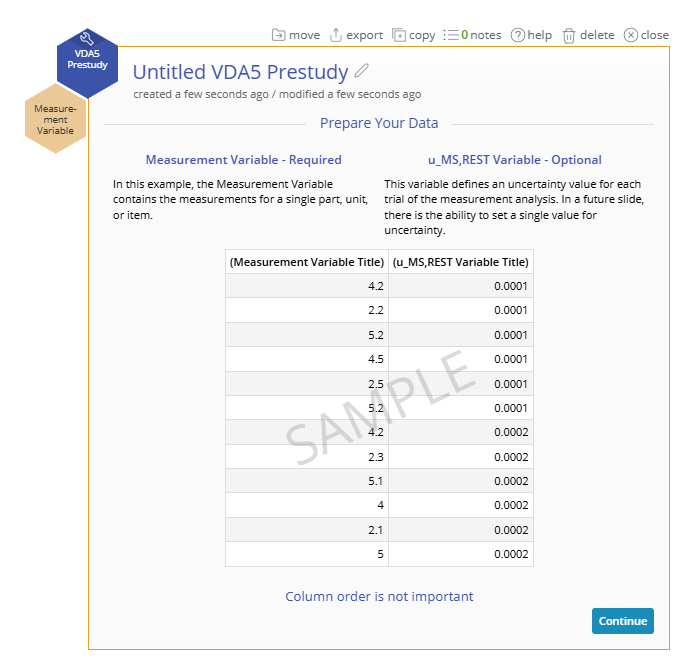
- Measurement Variable: This variable contains the measurements for the given gauge.
There is one optional hexagon attached to the study:
- U(ms)(rest): This can be used for a column of measurement uncertainties that cannot be directly captured from the prestudy data but should be considered in the output. This is optional.
Example:
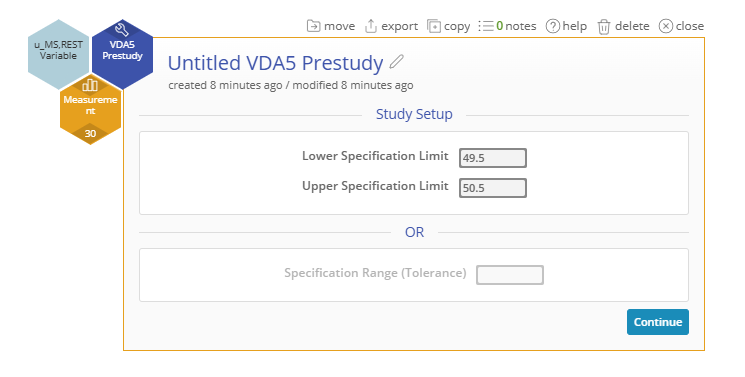
A manufacturing plant produces metal components that require tight dimensional control. One critical dimension—the outer diameter—has a nominal specification of 50.00 mm, with a process tolerance of 1 or ±0.5 mm (acceptable range: 49.5 mm to 50.5 mm).
To ensure consistent quality, the quality team performs a VDA5 Prestudy before a Gauge R&R to evaluate whether the guage is accurate.
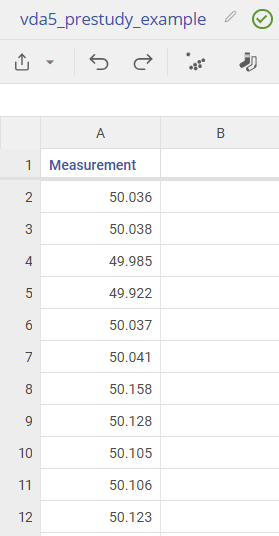
Open the data source to view the data for this trial.
Steps:
1. Go to Measure > Measurement System Analysis (MSA) > VDA5 and open the VDA5 Prestudy tool onto the workspace.
2. Navigate to the data source and drag Measurement onto the Measurement Variable hexagon.
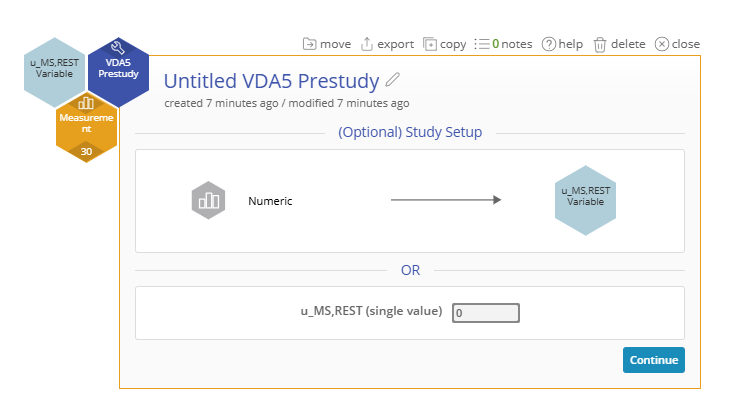
3. The U(ms)(rest) dropzone is OPTIONAL, so we will click Continue to skip it.
4. Input the Upper and Lower Spec Limit or a Tolerance. See the value below. Click Continue.
5. Input a reference level. See the value below.
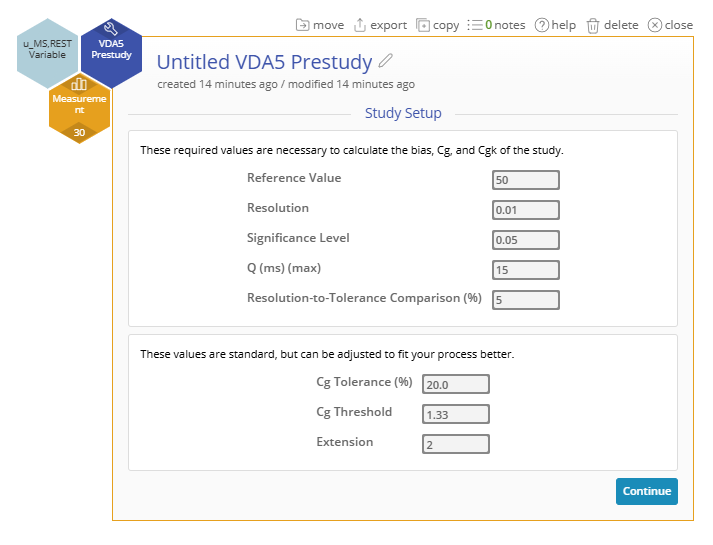
6. The other study options can be left at the defaults. Click Continue.
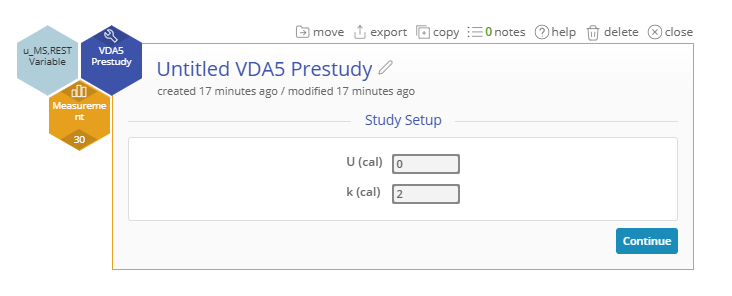
7. Finally, leave these options also at their default. Click Continue.
Results:
The VDA5 Prestudy results will look something like this.
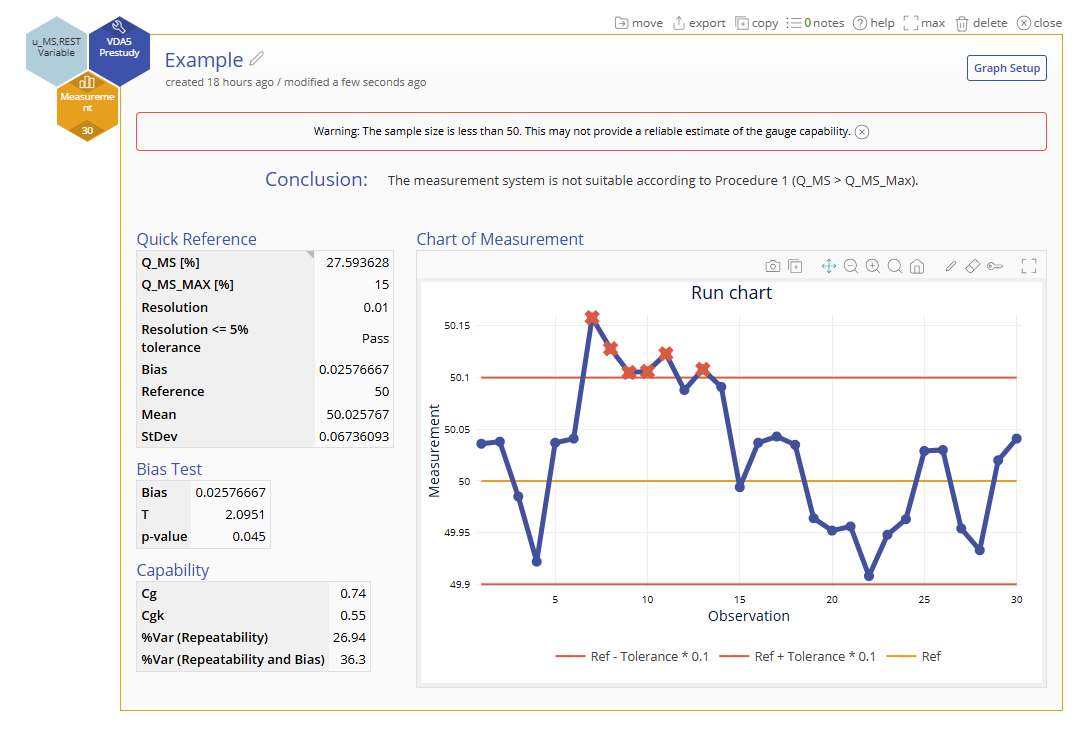
After scrolling down the left side:
The Conclusion at the top summarizes the key findings of the analysis by looking at the relationship between Q_MS and Q_MS_Max.
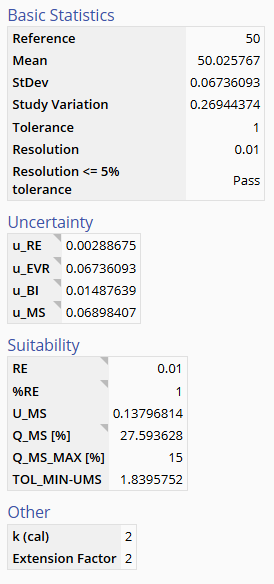
In addition, the statistics on the left provide relevant information like the resolution to tolerance percentage, the bias, mean, standard deviation, and more.
The run chart on the right shows what points fall outside the spec limits that have been specified.
Tutorial
Coming Soon
Was this helpful?