
Process Capability Analysis Tutorial
When to use this tool
Use the Process Capability Analysis study to assess the ability of a normally distributed process to meet customer requirements or specifications. The Capability Analysis output includes an overview of process stability, normality and capability.
The output includes:
- A histogram of the data with specifications as reference lines and the normal curve overlaid on the distribution.
- The appropriate control charts (XmR or Xbar and R/S) based on the subgrouping structure of the data.
- A capability plot comparing the process spread with the specification range (tolerance).
- A run chart assessing the independence of the observations.
- A normal Quantile-Quantile (Q-Q) Plot assessing the normality of the data.
- The numeric output including assumption checks, capability statistics, percent out-of-spec, percent yield (100% - percent out-of-spec) and the process sigma level.
How to use this tool in EngineRoom
1. Open the Normal Process Capability Analysis tool, located in the Measure (DMAIC setup) menu or Quality Tools (Standard) menu, in the Process Capability submenu. "Normal" indicates that we're looking for Process Capability where the process data has a normal distribution.
2. Drag a numeric variable on to the Data Variable hexagon dropzone next to the Subgroup Variable hexagon.
3. Drag a numeric/text subgroup variable on to the Subgroup Variable drop zone OR Enter a subgroup size in the box provided. Click Continue.
- Tip: A subgroup contains the items measured together at the same time, under the same conditions. The subgroup variable identifies these subgroups in your data; for example, if you measure five parts coming off the production line every hour, your subgroup variable labels the first five parts as '1', the next five parts as '2', etc.
- Tip: If you measure five parts coming off the production line every hour, your subgroup size is 5. If you only measure one item per time period, your subgroup size is 1. Enter the appropriate numeric value in the Subgroup Size box.
- Note: Your subgroups must all be the same size for this analysis.
4. On the 'Enter Specification Limit' screen, enter AT LEAST one specification (lower and/or upper) limit value in the boxes designated for Lower and Upper Specification Limits. Click Continue.
5. On the 'Study Setup' screen, you have the option to change the default values of the cut-offs for deciding the Anderson Darling Normality Test and the minimum acceptable Cpk capability statistic. Change these values if desired and click Continue.
6. On the ‘X Chart Tests’ and ‘Range Chart Tests’ screen, select the desired tests for checking the stability of the process - only the first test ('Any point outside the control limits') is chosen by default. In addition, you can enter an optional Target value for the process on this screen.
7. Click the Continue button in the dialog when done.
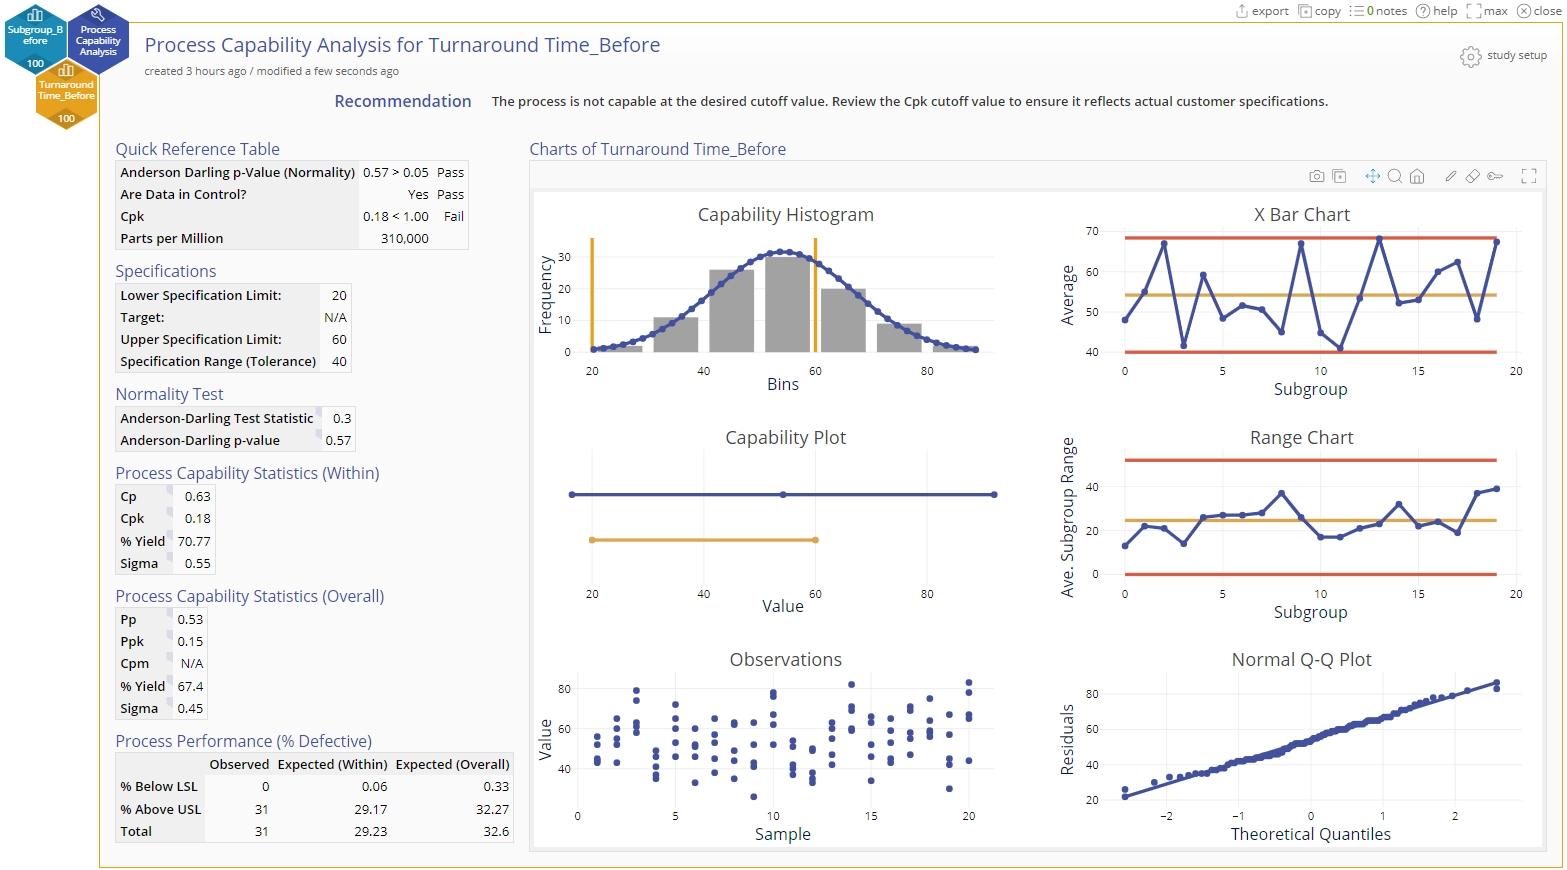
The Process Capability Analysis output is shown below:
Comparing Stages in Process Capability
EngineRoom has the ability to label different stages of your data in Process Capability, and view the statistics for each group side by side.
1. Ensure that your data is stacked, that is, the values for stage 1 and stage 2 are in a single column.
2. Create a second column that labels each value in the first column with which stage it is in (for example, "Stage 1" and "Stage 2", or "Before" and "After". Note: Process Capability can only have two stages.
3. Drag on the values onto the yellow dropzone.
4. Determine the subgroup size. Note: The subgroup size must be the same for both stages.
5. Drag the stage labels onto the pink dropzone.
6. Continue with the study as normal.
7. Results will show:
- Two histograms, with related line charts, comparing the two Stages
- A full six pack for each Stage
- Table data split for each Stage
Was this helpful?