
Bowker Test for Attributive Analysis
When to use this tool
When conducting an analysis between appraisers for attributive analysis, you may be interested in using the Bowker Test for Attributive Analysis. This test helps answer the question "Is there a significant difference between the measurements of appraiser A vs appraiser B?" The Bowker Test is used with the VDA5 Standard.
With a reference value present, the Bowker Test for Attributive Analysis compares:
- Appraisers with the Reference
- Appraisers against other Appraisers
And determines whether the differences between them are significant.
Using EngineRoom
(Note: the example is shown with Guided Mode turned off, which exposes all of the dropzones at the same time. To turn off Guided Mode, go to the User menu in the top-right corner and turn Guided Mode off.)
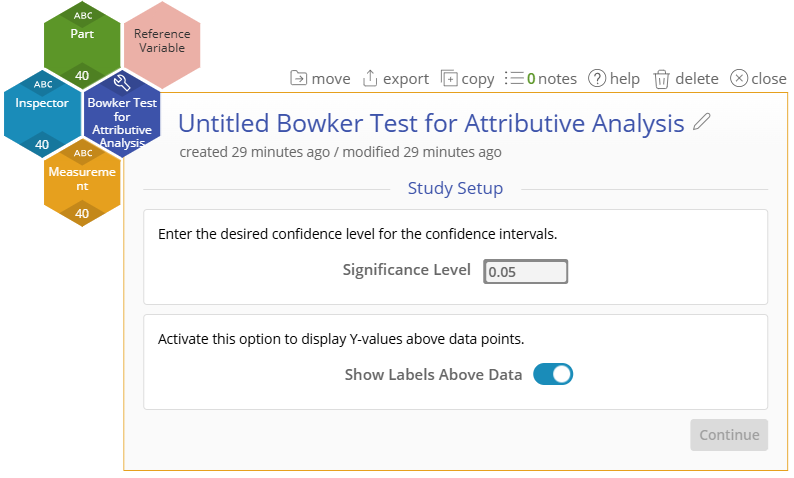
To use the tool, in the DMAIC menu select Measure > Measurement System Analysis (MSA)... > VDA5 > Bowker Test for Attributive Analysis (In the Standard menu, select the tool under Quality Tools > VDA5). The study opens on the workspace:
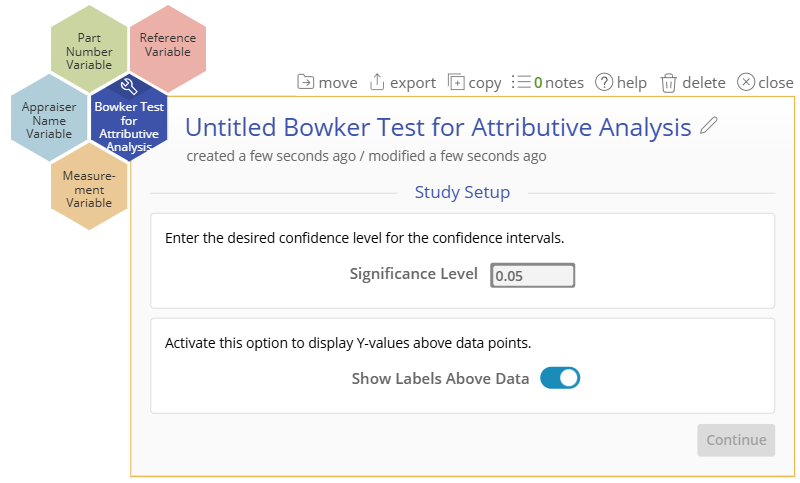
There will be four required hexagons or 'drop zones' to attach to the study:
- Measurement Variable: This variable contains the measurements recorded by the Appraisers
- Appraiser Variable: This variable is the name or label of the appraiser
- Part Number Variable: This variable is the part number being appraised.
- Reference Variable: This variable contains the correct value for the measured part. Each part can only have a single reference value associated with it.
Example:
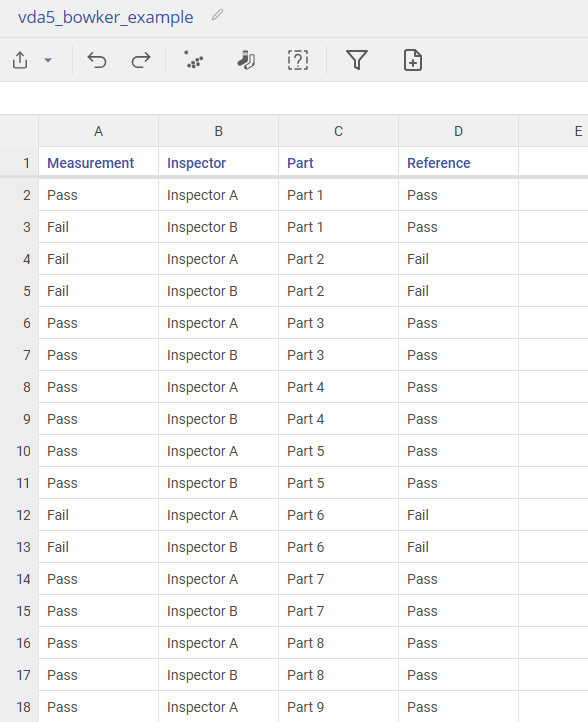
A manufacturing plant is evaluating their measurement system in order to ensure good quality. They pull 20 parts off the line and have two different appraisers measure the parts as Pass or Fail.
Open the data source to view the data for this trial.
Steps:
1. Go to Measure > Measurement System Analysis (MSA) > VDA5 and open the Bowker Test for Attributive Analysis tool onto the workspace.
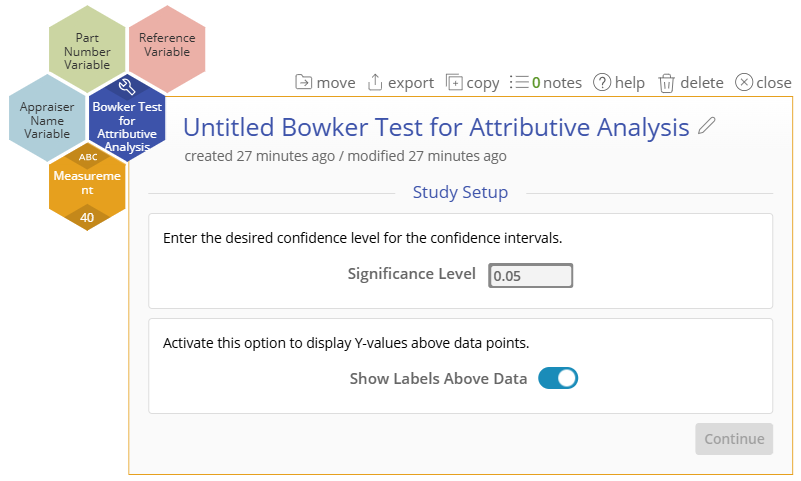
2. Click on the data source and drag Measurement onto the Measurement Variable hexagon.
3. Drag on the Inspector variable to the Appraiser Dropzone.
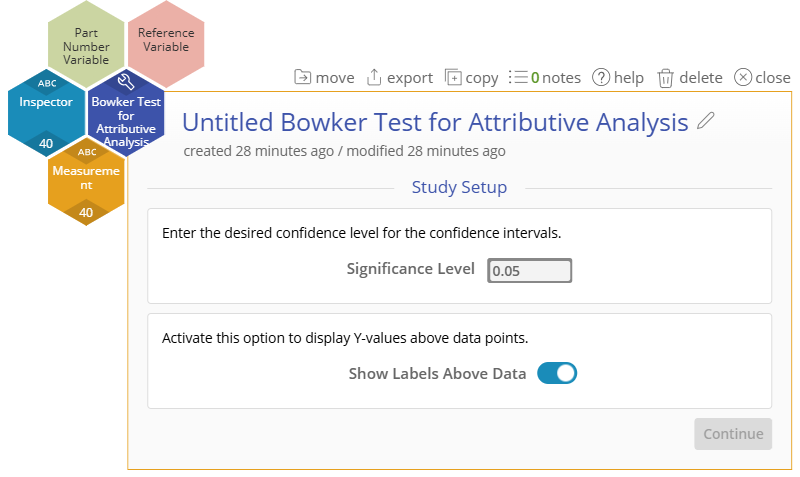
4. Drag on the Part variable onto the Part Number Dropzone.
5. Drag on the Reference variable onto the Reference Dropzone.
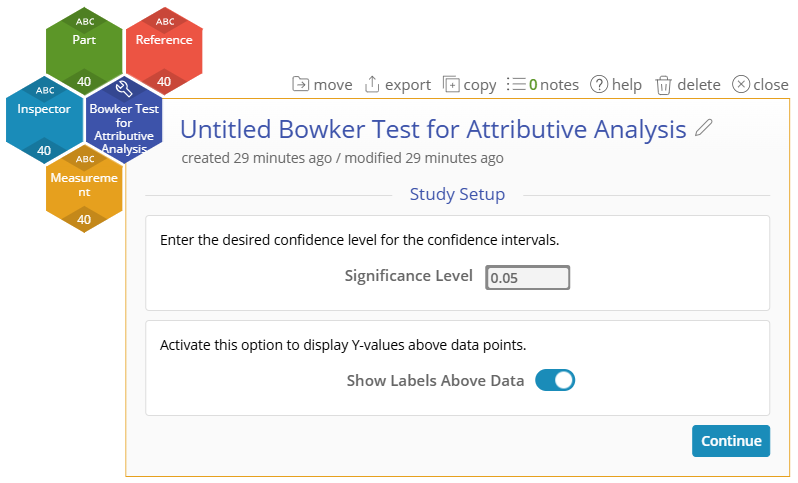
6. Finally, leave the Study Setup options at their default. Click Continue.
Results:
The Bowker Test of Attributive Analysis results will look something like this.
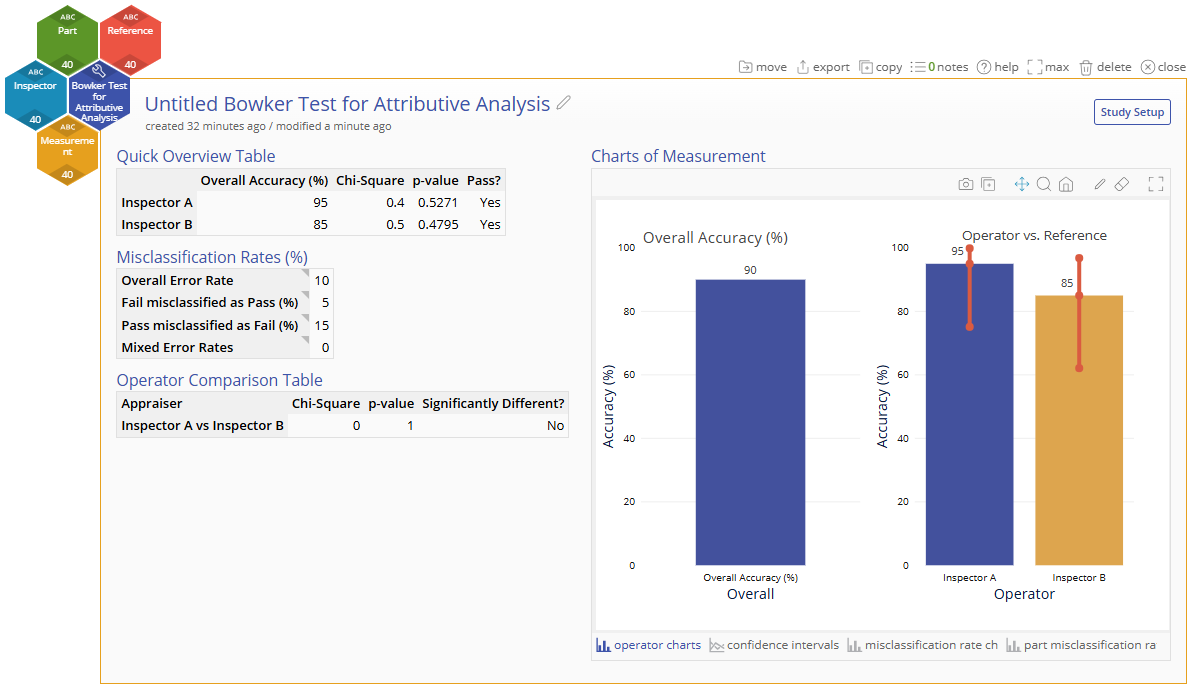
The statistics tables down the left side are the results of all of the comparisons in the study.
The output includes the following:
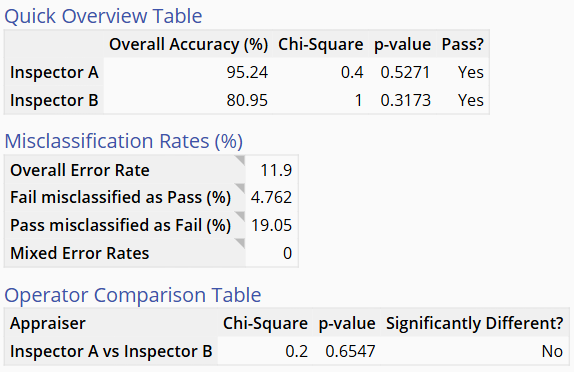
- Quick Overview Table compares each appraiser to the true reference values.
- Misclassification Rates (%) breaks down the different errors made throughout the entire study.
- Operator Comparison Table compares the each appraiser in the study to one another.
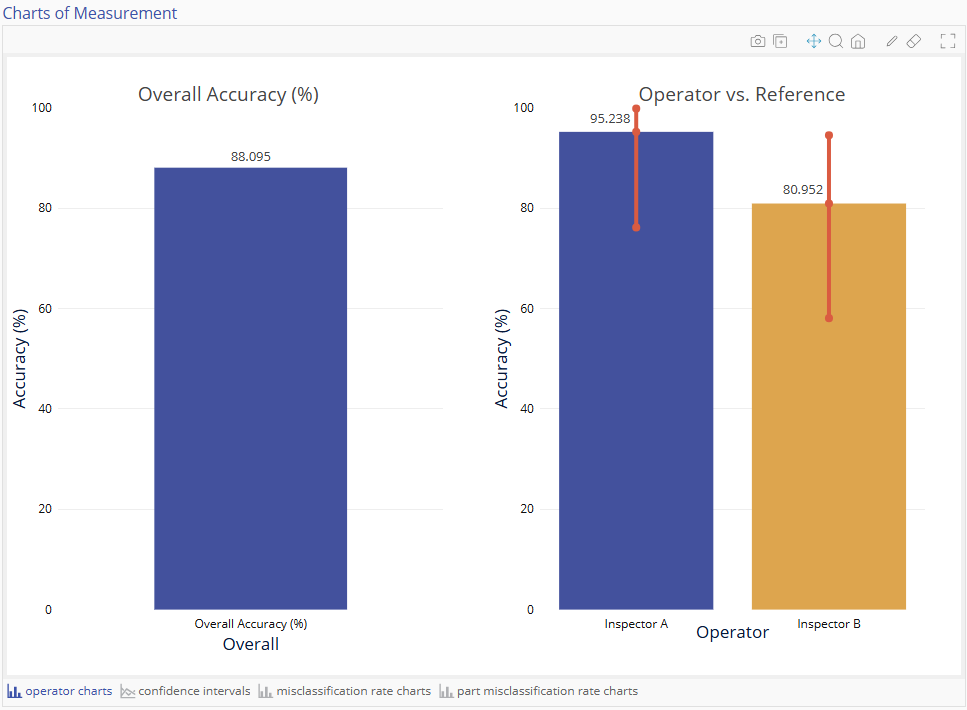
The operator charts on the right visualize the overall accuracy of all appraisers in the study and each appraiser's individual accuracy. The individual appraiser chart also includes a 95% confidence interval for the appraiser's true accuracy.
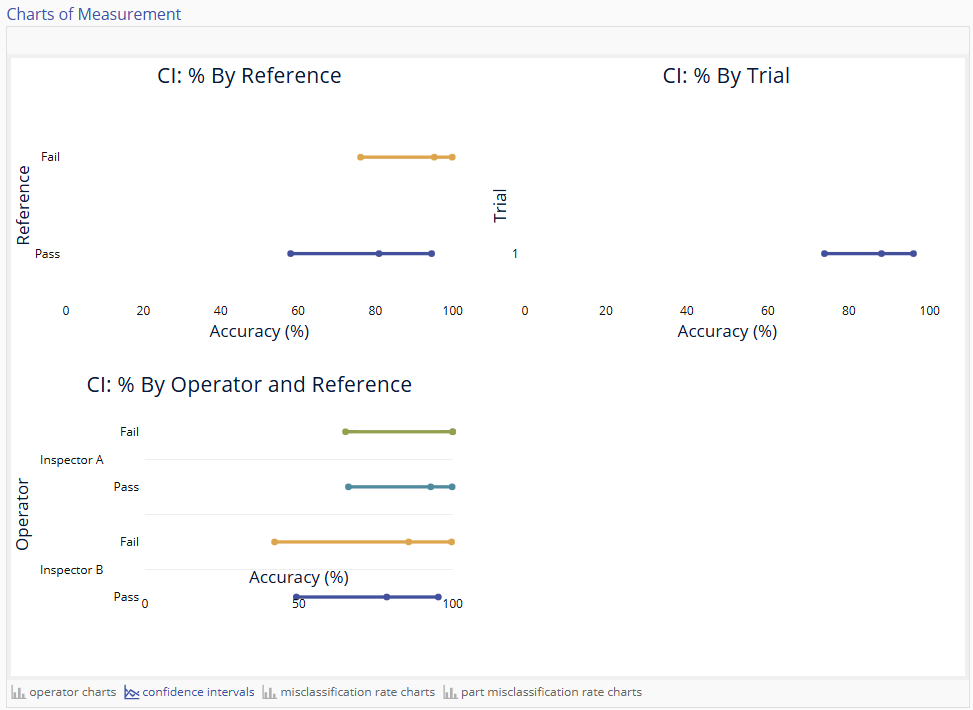
The next tab at the bottom is the confidence intervals tab. Here we visualize the 95% confidence intervals for the true accuracy of all the comparisons in the study.
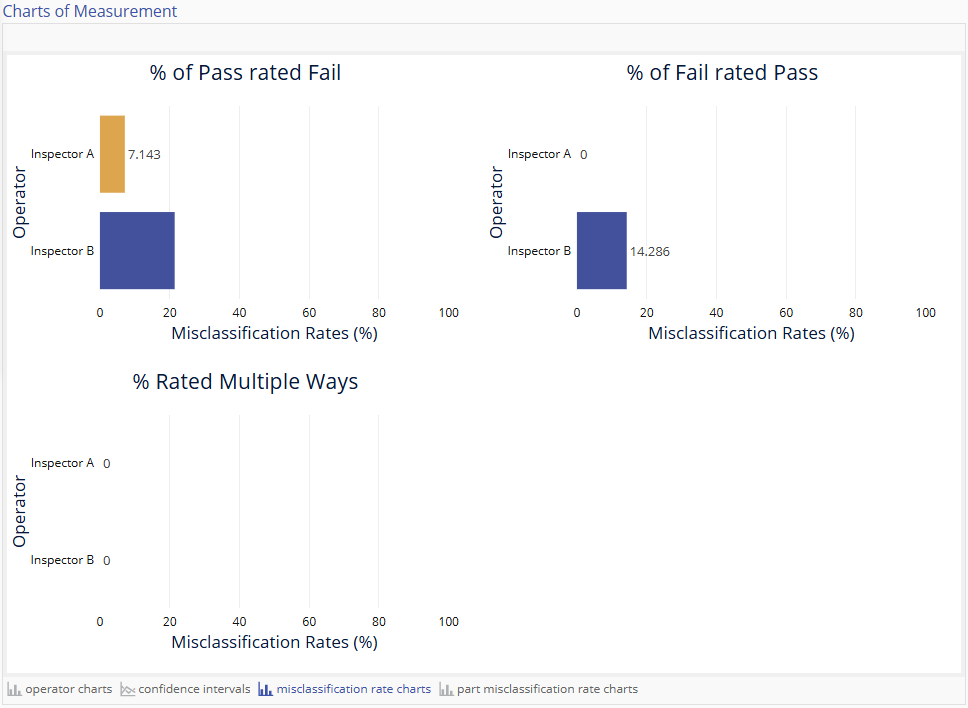
The next tab at the bottom is the misclassification rate charts. Here we visualize the different misclassification rates for each appraiser in the study using bar charts.
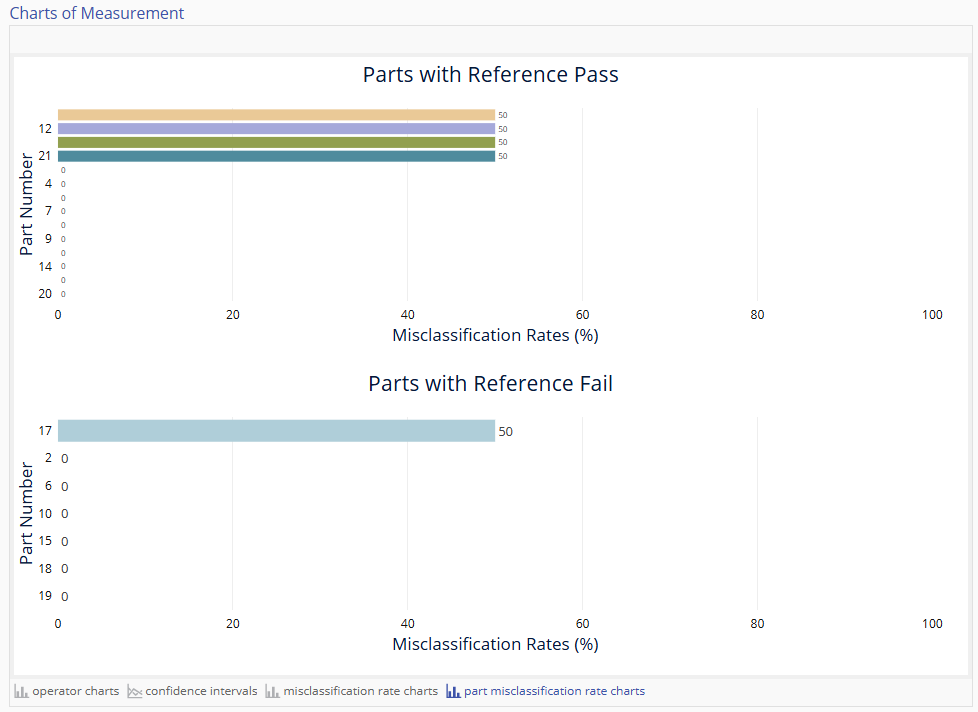
The next tab at the bottom is the part misclassification rate charts. Here we visualize the different misclassification rates for each part in the study using bar charts. If a part has a high misclassification rate, that may be a signal that the part's reference value is incorrect.
After reviewing our results, we can conclude that the two appraisers are not significantly different than one another and their accuracies are not significantly low. Their accuracies and misclassification rates should be assessed based on the practical needs of the process, but that will be left to the user.
Tutorial
Coming Soon
Was this helpful?