
Analyzing a Design
Once you have created a design, and have run your experiment, then you are ready to analyze your design.
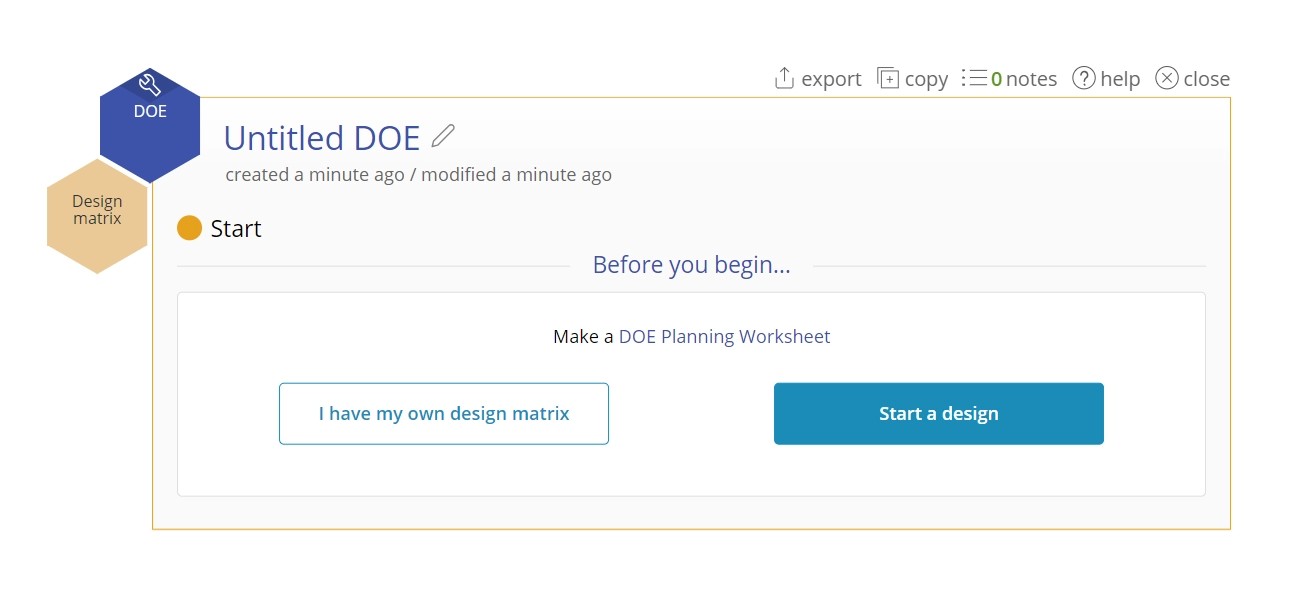
1. Use the existing DOE tool that you used to create your design, or create a new DOE tool.
- If you created a new tool, click "I have a design matrix."
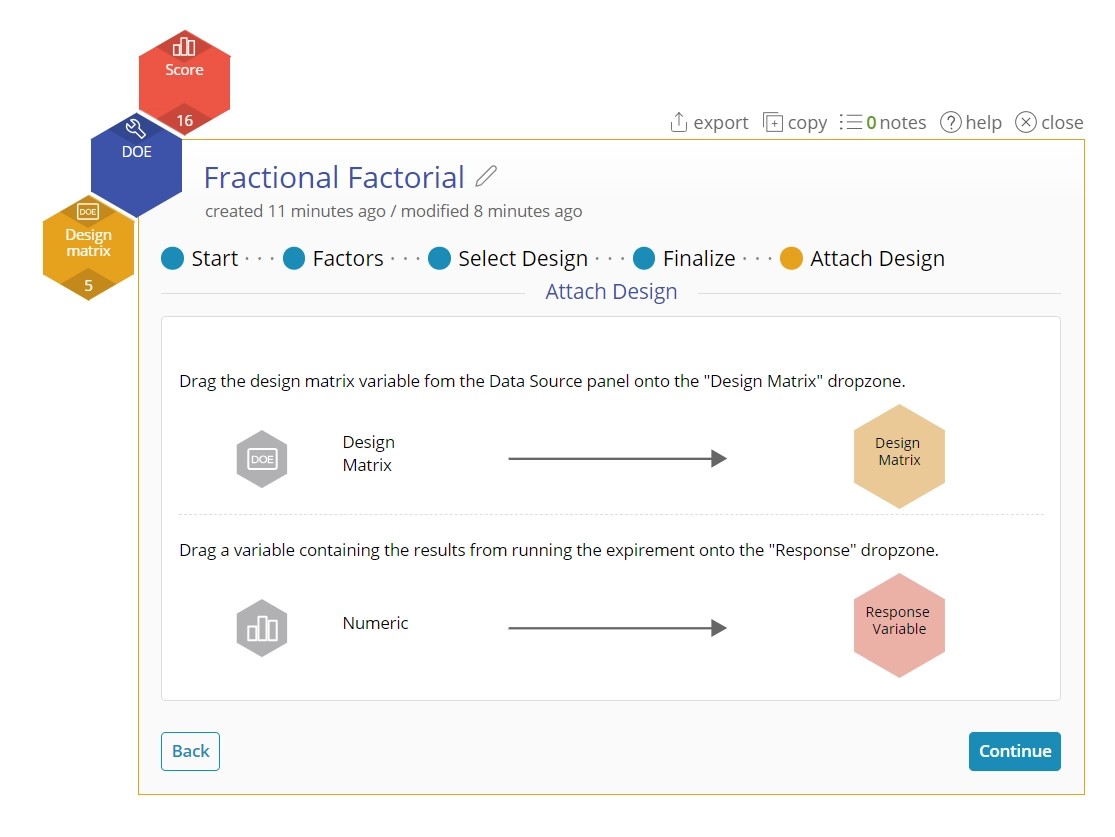
2. Drag on your Design matrix into the yellow dropzone.
3. Drag on your Response variable into the red dropzone. NOTE: The DOE tool can only analyze one response at a time. Create multiple DOEs to analyze multiple responses.
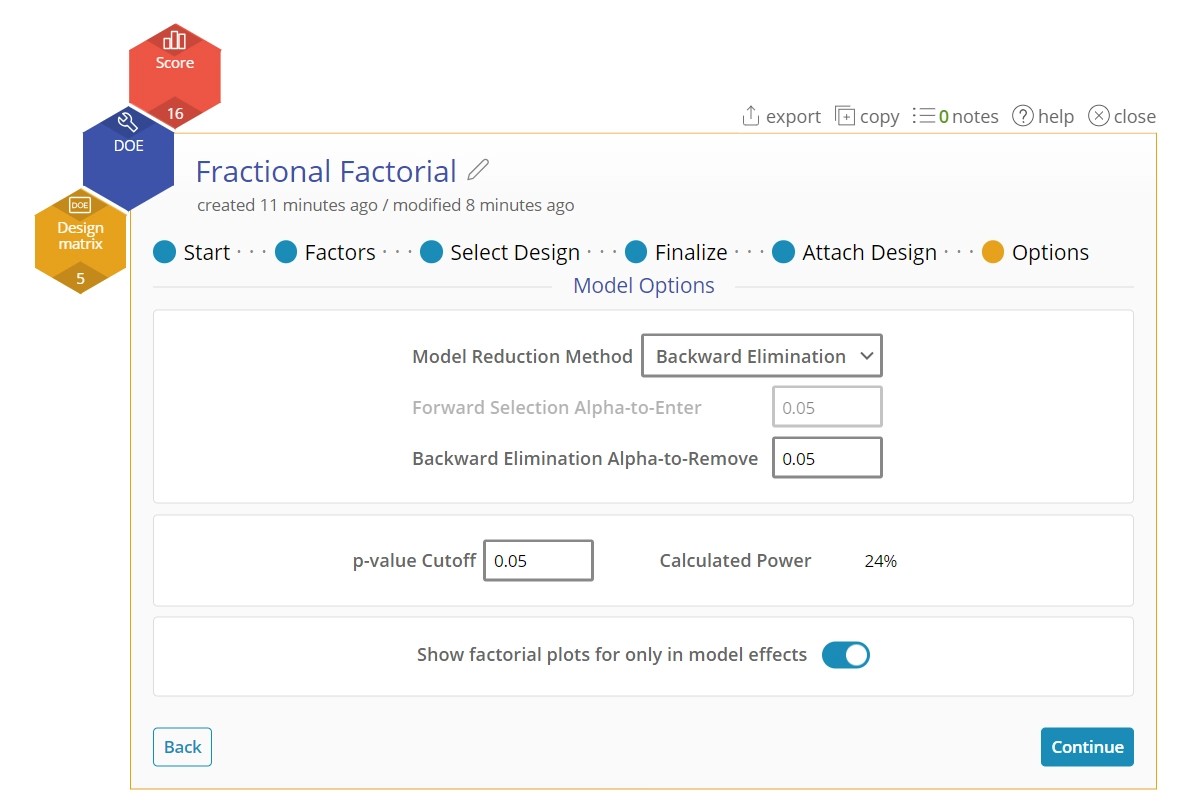
4. On the options screen, there are many choices:
- Model Reduction Method: The final model is reduced from just the total output. While we have several options the default is sufficient in most cases. Here you can also select "Manual Reduction" which would bring you to edit the model.
- Desired Significance Level: Here you can adjust the desired significance level. Note that this affects the power of your design.
- Plot only significant factors: This reduced the number of plots to look at and is on by default.
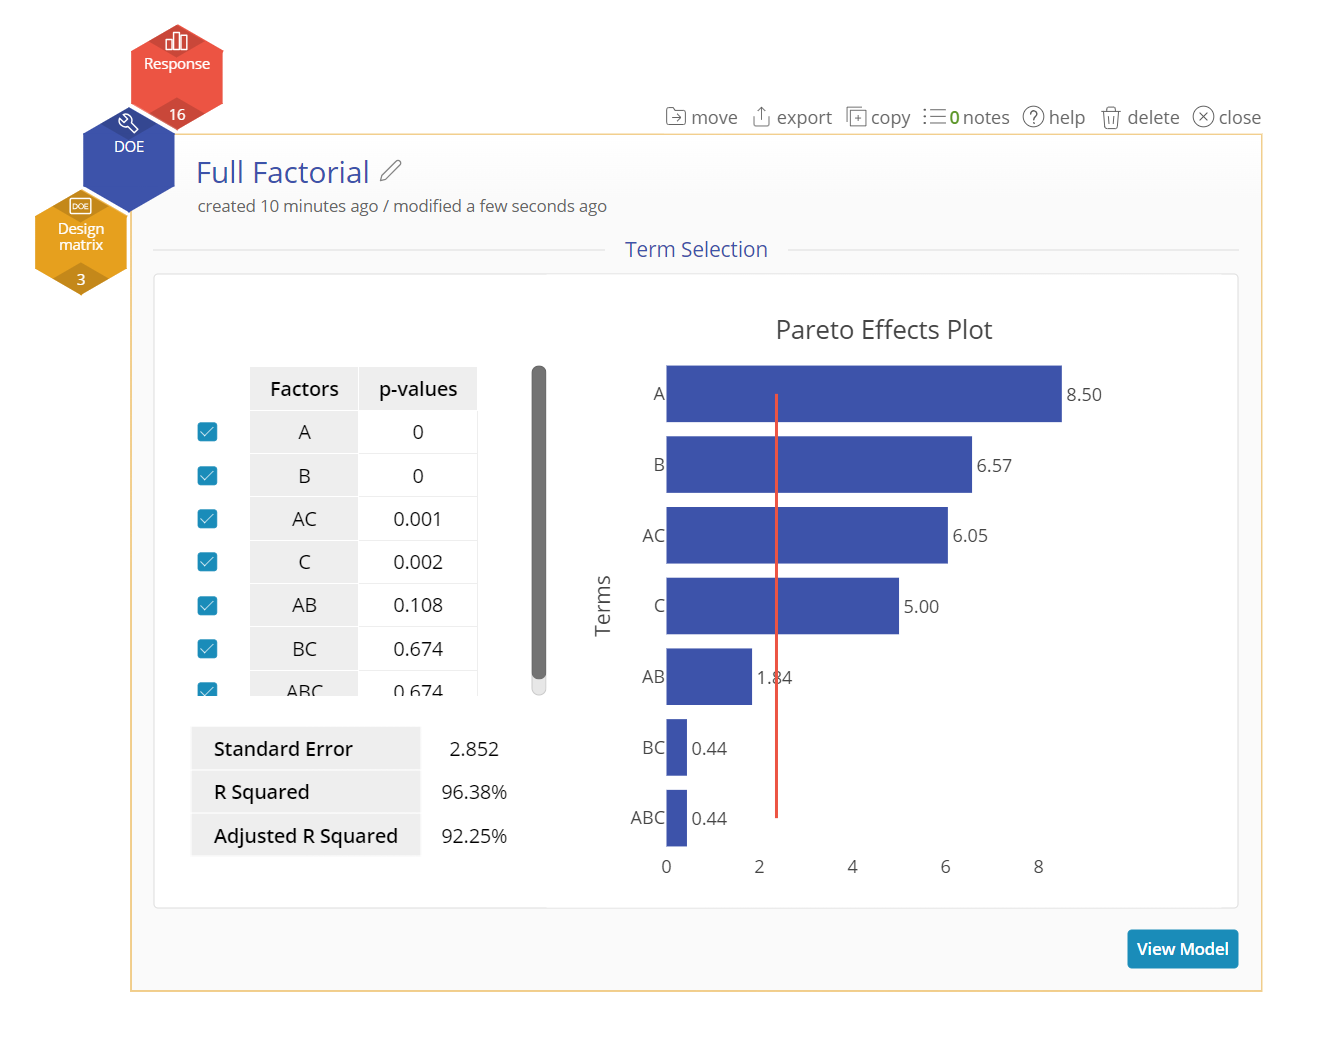
5. (Optional) If you selected "Manual Reduction", you will arrive at the Term Selection screen. This allows you to select and deselect certain factors from your model, observing the effects on the p-value and on the effect sizes.
7. View the results of the generated model.
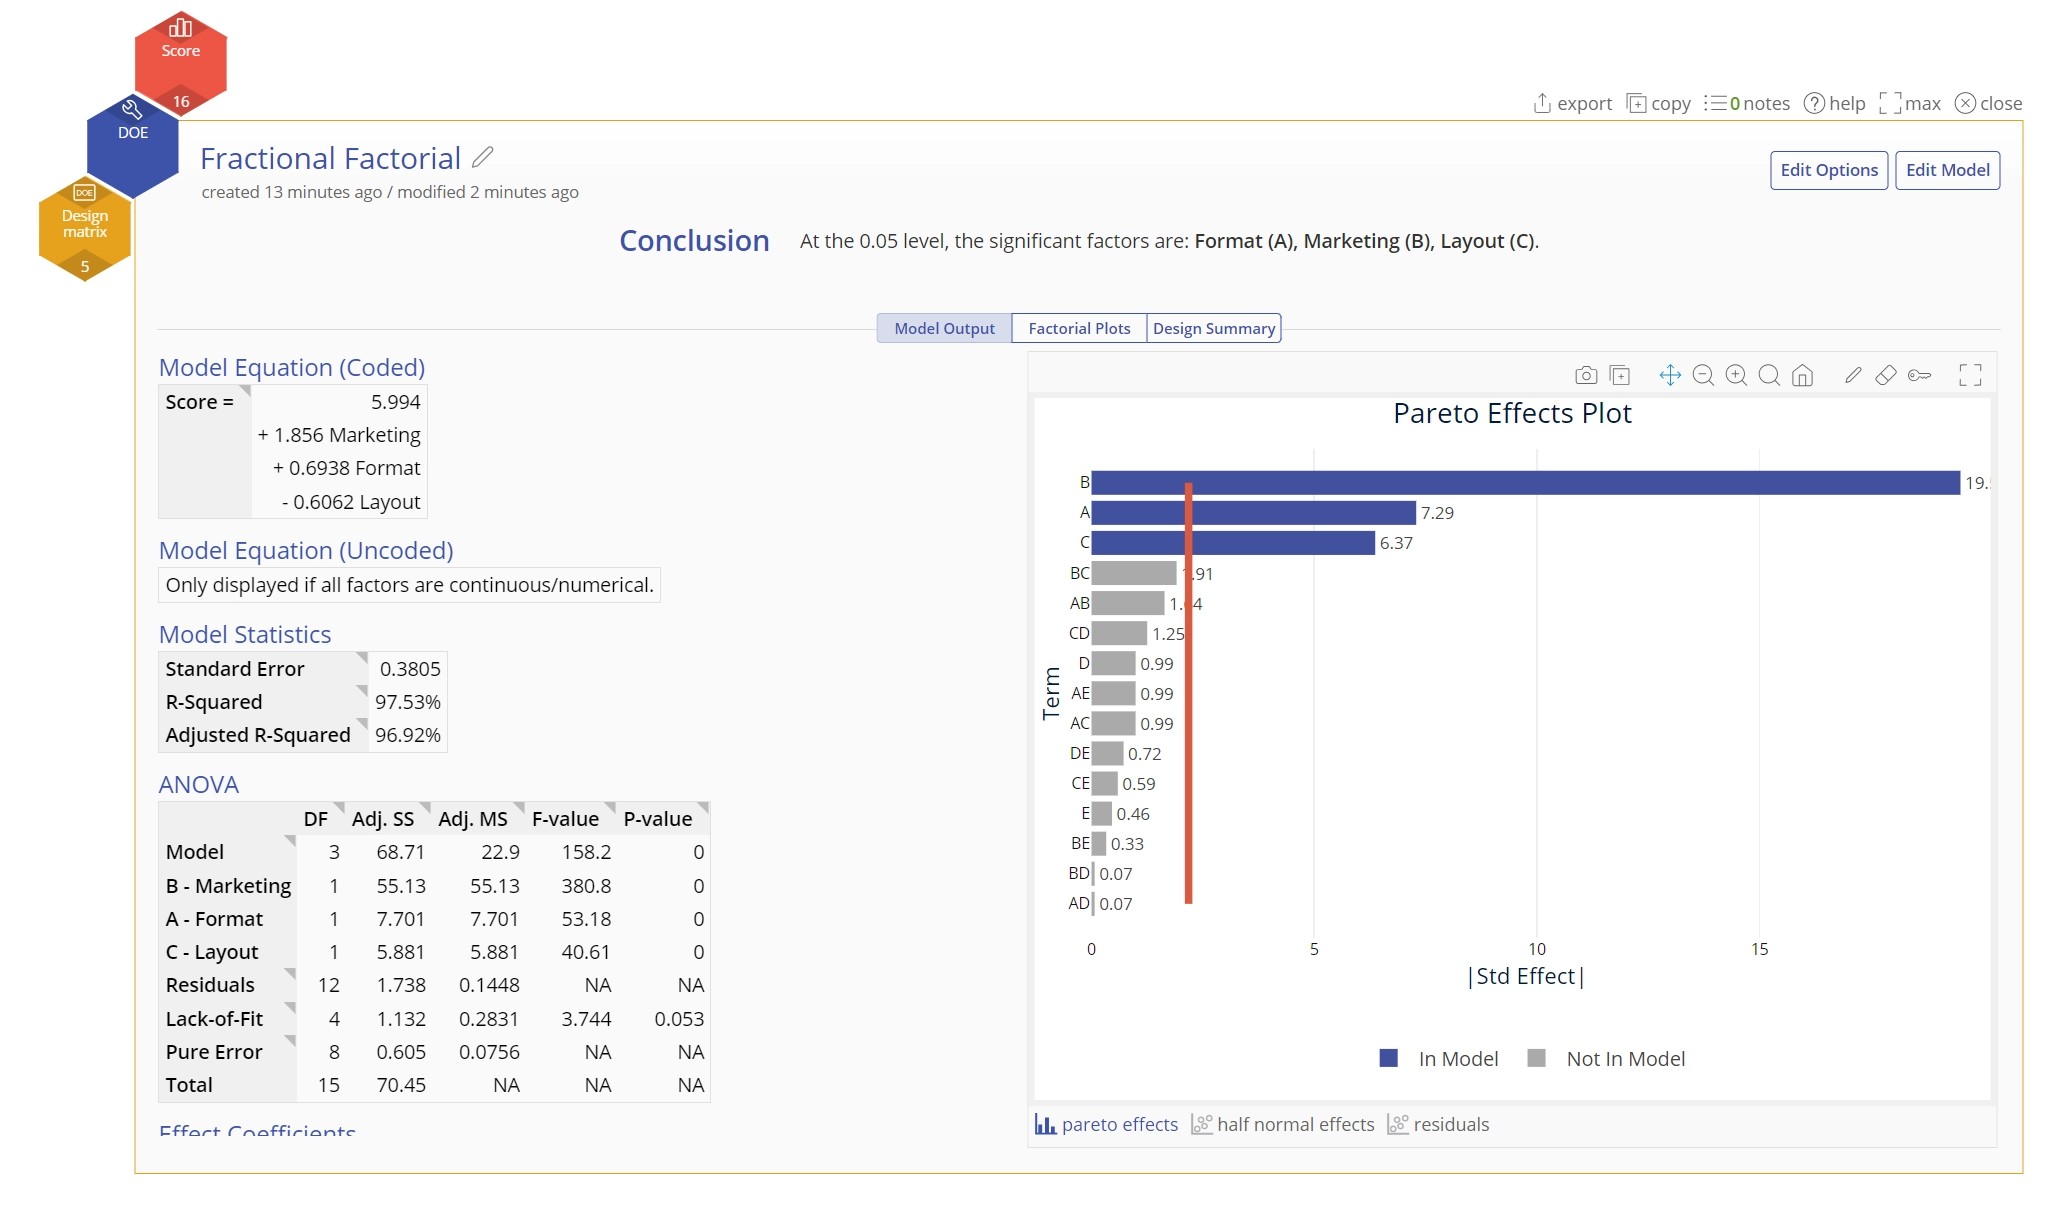
Results of DOE Analysis
This portion of the tool displays:
- The conclusion of the model.
- The final output of the model.
- Various factors that indicate the significant of each of the factors.
- The main effects, interaction plots, and cube plots for visual representations of the data
- And a summary of the design that was input into the Analyzer.
View the examples of each type of DOE for more details.
Was this helpful?