
How to Build a Dashboard
Adding a Report
In order to create a TRACtion dashboard, you first must create a report. For help on building your first report, refer to our help guide on report creation.

A TRACtion Dashboard with three charts
Adding to the Dashboard From a Report
While reviewing a report that has been saved previously, click the dashboard icon in the top right of the report window.

The dashboard icon above is circled in green.
If you have created dashboards previously, they will be listed here. Otherwise you will need to click the "Create New Dashboard" button to setup a dashboard.
Adding the Report to a New Dashboard

The image above shows three dashboards that the report can be assigned to
To create a dashboard from scratch, click "Create New Dashboard". This will load a screen where you can customize the following on the dashboard:
- The Name of the Dashboard
- How Many Charts to Display in a Row
- Whether or Not the Dashboard is Shared with your Company
- Which Reports are Included
- Which Project KPIs are Included

Above, the new dashboard has been named "My Customized Dashboard" and is set to display 1 chart per row for a given report.
When adding reports, you may either update their setting of how to display them in the dashboard from the dropdown:
- Report with Chart
- Report Only
- Chart Only
or drag the reports above the active/inactive line.
KPIs can be dragged as well or if you click the checkbox next to their name they will be included on the dashboard.
Both Reports and KPIs can be reorganized by dragging and dropping their names in the desired order.
When finished, click either "Create Dashboard" button.
Adding the Report to an Existing Dashboard
Click on the dropdown for the dashboard you wish to add the report to and select how you would like the report to be displayed:
- Report with Chart
- Report Only
- Chart Only

In the example above, the report is being added to "Demo Dashboard"
Once selected, the report will now be associated with the dashboard of your choice

In the example above, the report has been added to "Demo Dashboard"
Adding to the Dashboard Directly
From the Report Dashboards screen, if you have made or have access to any dashboards they will display here. You can create new dashboards or edit existing ones.

Creating a New Dashboard
To create a dashboard from scratch, click "Create New Dashboard". This will load a screen where you can customize the following on the dashboard:
- The Name of the Dashboard
- How Many Charts to Display in a Row
- Whether or Not the Dashboard is Shared with your Company
- Which Reports are Included
- Which Project KPIs are Included

Creating a new Dashboard
Dashboards can include both reports and KPIs. When adding reports, you may either update their setting of how to display them in the dashboard from the dropdown:
- Report with Chart
- Report Only
- Chart Only
or drag the reports above the active/inactive line. KPIs can be dragged as well or if you click the checkbox next to their name they will be included on the dashboard.
Both Reports and KPIs can be reorganized by dragging and dropping their names in the desired order.
When finished, click either "Create Dashboard" button.
Editing an Existing Dashboard
To edit an existing dashboard, click the pencil icon next to the dashboard you wish to make changes. This will open the screen where changes can be made.

The "Edit Dashboard" Icon
When you are ready to save your changes, click "Update Dashboard".

In the above example, the dashboard contains two reports, two KPIs and is configured to display three charts per line
Pinning a Dashboard
To pin a dashboard, click the pushpin icon. This will set the dashboard as your default dashboard. Pinning a dashboard will load the dashboard automatically if you choose to set the dashboard as your TRACtion homepage.
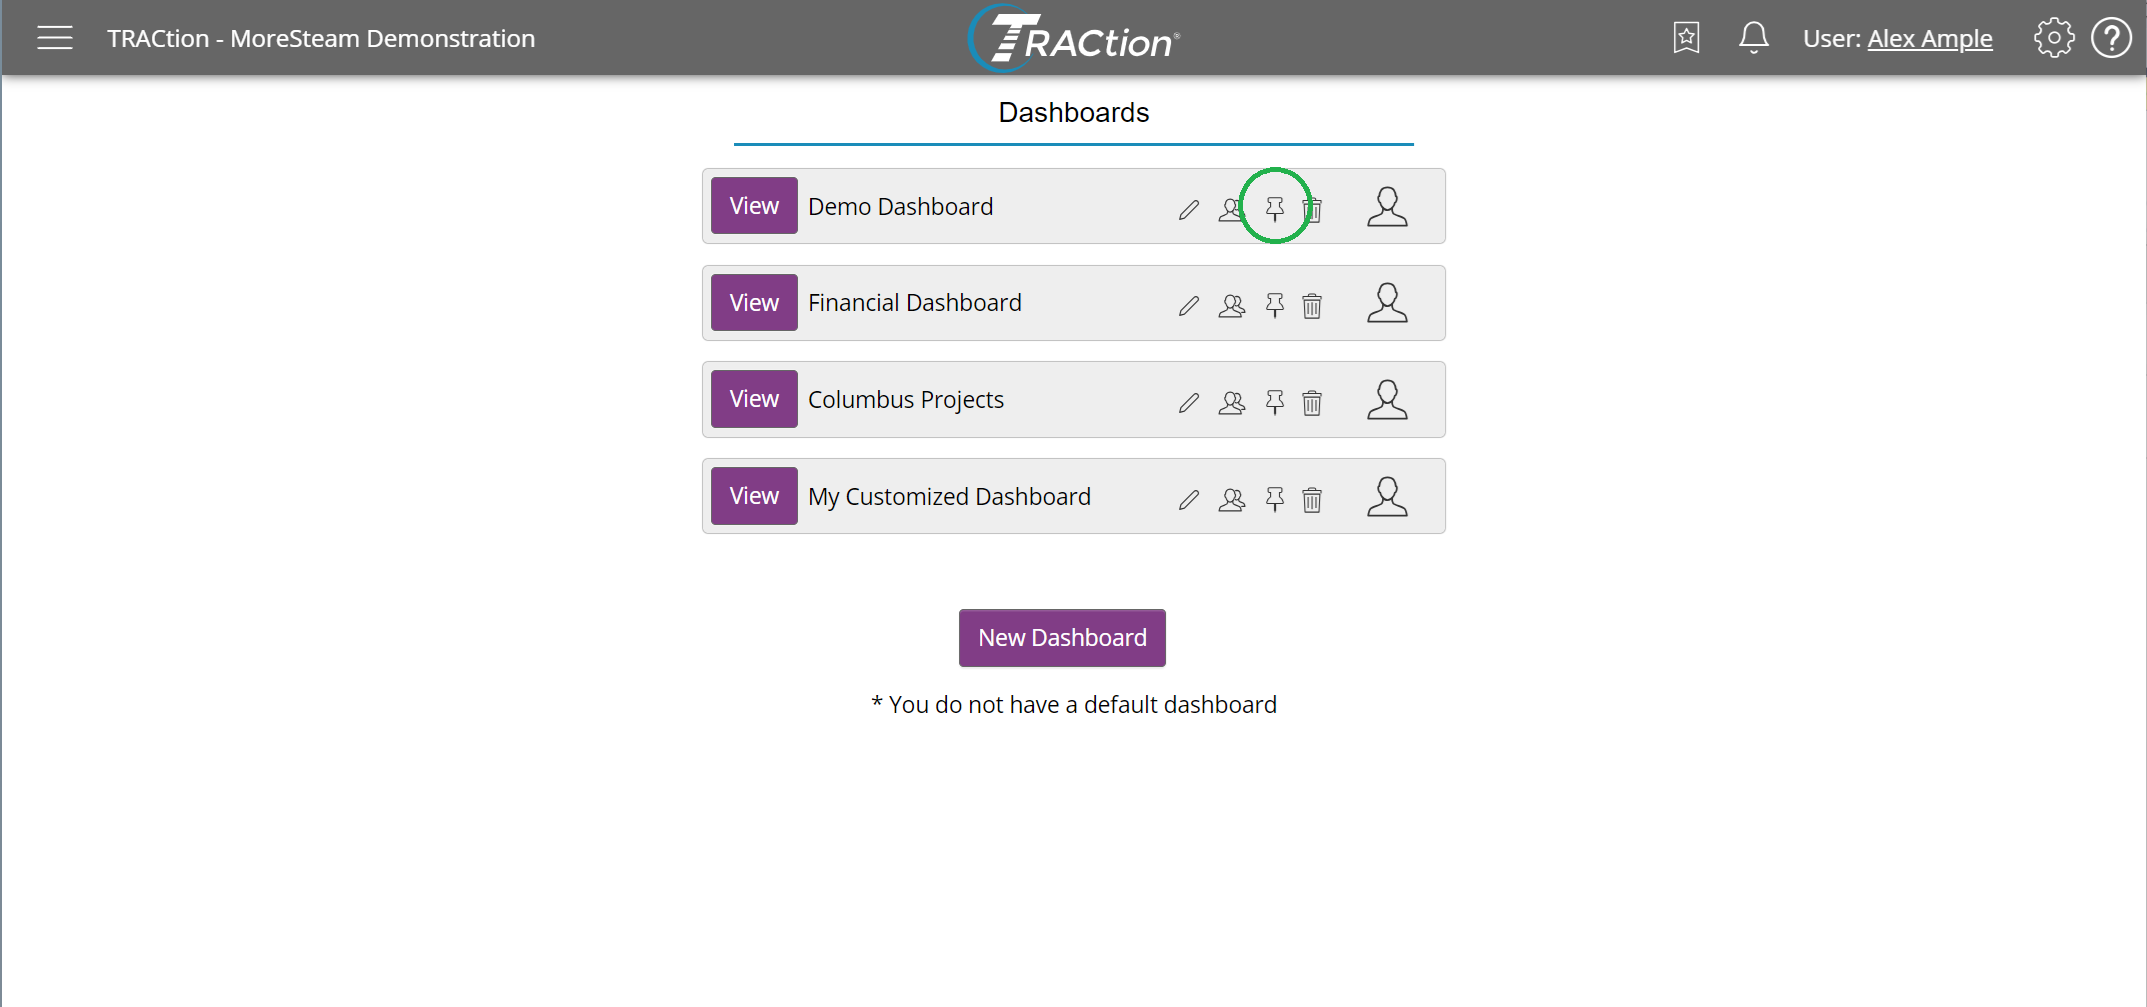
The "Pin Dashboard" button
Once clicked, a pinned dashboard will appear with an orange pushpin icon. Only one dashboard can be pinned at a time.
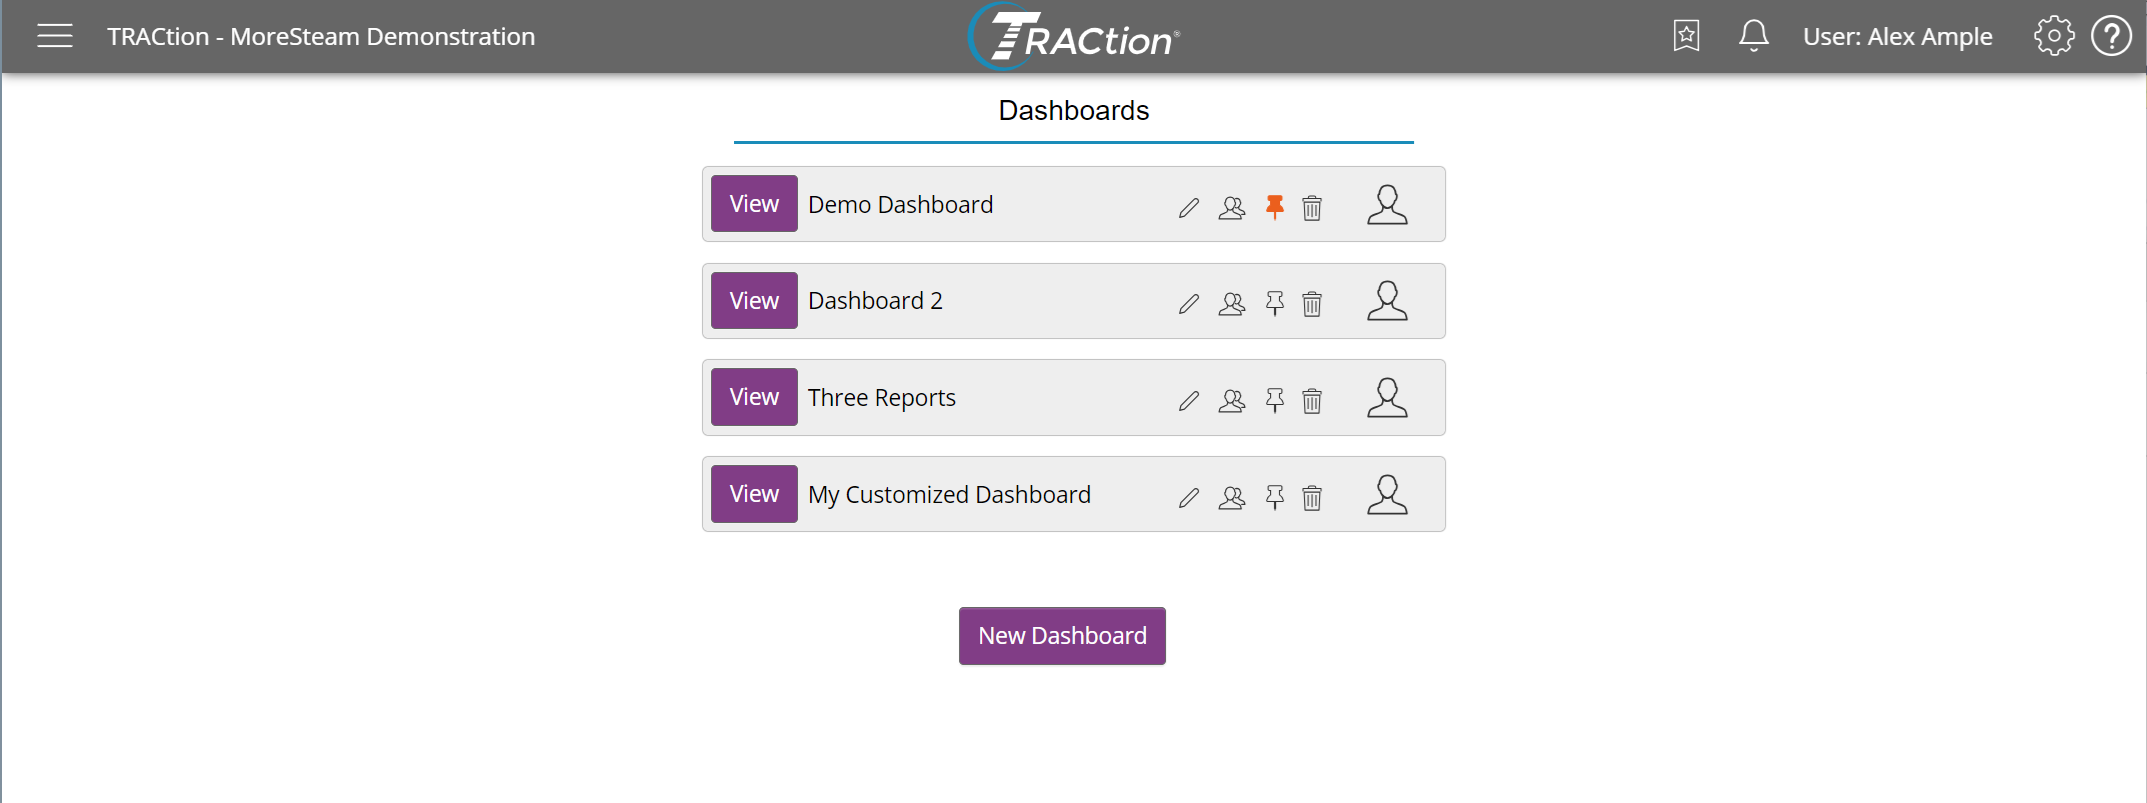
A "pinned" Dashboard
Alternatively, clicking the homepage icon while viewing a dashboard will automatically pin a dashboard for you in addition to setting the dashboard as your homepage.
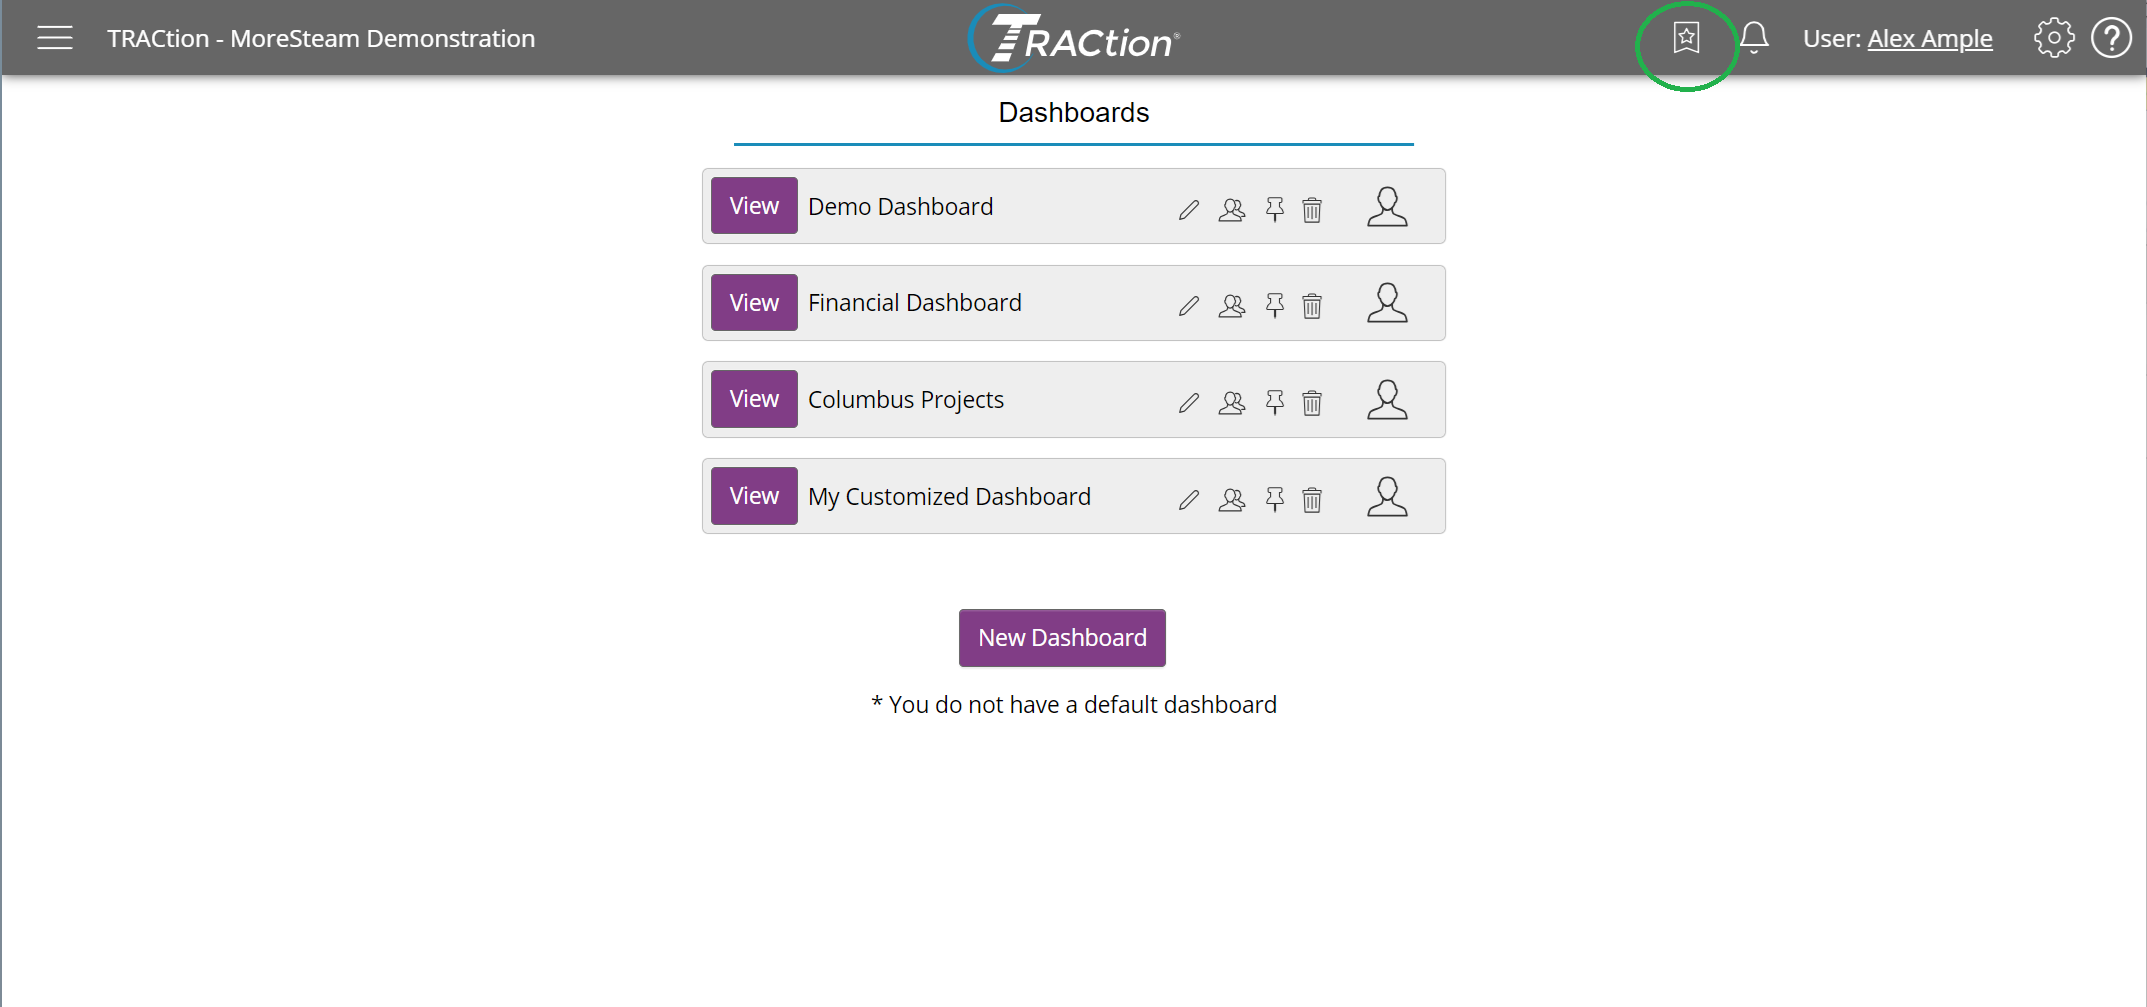
The "Set Homepage" button
Deleting a Dashboard
To delete a dashboard, simply click the trash can icon. This will remove the dashboard from your view and remove access to anyone who you had shared the dashboard with.
The "Delete Dashboard" button
Was this helpful?