Monte Carlo Simulation
What is Monte Carlo simulation?
Monte Carlo simulation is a statistical method used to understand the range of possible outcomes when one or more inputs to a process are uncertain or variable. Instead of calculating a single answer using fixed input values, a Monte Carlo simulation repeatedly samples possible input values and calculates the resulting output. After hundreds, thousands, or even millions of trials, the results show (1) what could happen and (2) how likely different outcomes are to occur.
Suppose three components are assembled and their dimensions determine the total length of the finished product. Each component has an average dimension, but none is manufactured to precisely the average dimension every time. Adding the three average dimensions tells you the expected average length of the assembly. What you want to know is how much the finished assembly will vary or how often it might fall outside specification. A Monte Carlo analysis can answer those questions.
How Does Monte Carlo Simulation Work?
A Monte Carlo model represents the mathematical relationship between the inputs to a process and the output you want to study.
In its simplest form: Inputs → Model → Output
Some inputs may be fixed while others are uncertain and represented with probability distributions. For each trial, the simulation randomly selects values from those distributions, runs them through the model, and records the result. This process is repeated many times.
For example, suppose total process time depends on three steps: Total Time = Step A + Step B + Step C
If Step A always takes exactly 5 minutes, Step B averages 10 minutes but varies from cycle to cycle, and Step C ranges from 4 to 8 minutes, using the averages would produce only one estimate for total process time. Monte Carlo modeling takes the variability into account.
One simulated run might produce: 5 + 9.2 + 6.1 = 20.3 minutes
Another might produce: 5 + 11.4 + 7.5 = 23.9 minutes
Another might produce: 5 + 8.8 + 4.7 = 18.5 minutes
Repeat this process thousands of times and a distribution of total process times begins to emerge. You can then estimate the average, variation, percentiles, probability of exceeding a target, or other measures important to the process. The Monte Carlo method is particularly useful when a process has several sources of variation interacting at the same time. These might include differences in processing times, demand, material properties, costs, dimensions, failure rates, and so on.
Why Use Monte Carlo Analysis?
Many decisions are made using averages or best estimates. Unfortunately, averages can hide risk. Monte Carlo simulation provides a way to quantify uncertainty and the associated risk by estimating the probability of an outcome occurring.
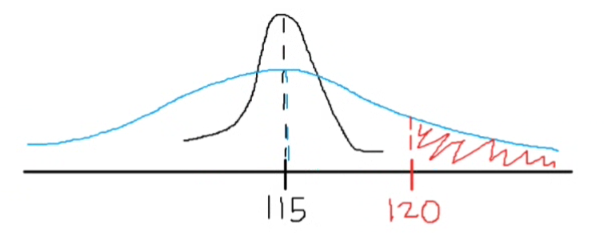
Suppose you are given a deadline of 120 days on a project. The project manager’s best estimate is that the project will be completed in 115 days, based on the average duration of each activity. That sounds reassuring as you have five days to spare. But what if variability in the individual activities causes you to miss your deadline?
The illustration below shows why the average alone is not enough. Both distributions have the same average project completion time of 115 days, but they have very different amounts of variation. With the narrow distribution, project completion times remain relatively close to 115 days, making it unlikely that the project will exceed the 120-day deadline. With the wider distribution, the average is still 115 days, but there is a much greater chance of finishing after 120 days. The red area represents that risk.
Using Monte Carlo, you can figure out which activities are most influential in meeting the deadline or you can find the deadline that gives you a suitable probability of success. This is one reason Monte Carlo simulation is such a useful tool for continuous improvement practitioners. It helps turn the variation you already measure into a clearer picture of the risks and possible outcomes behind a decision.
Monte Carlo is useful in many ways including:
- Estimate the probability of meeting specifications
- Evaluate tolerance stack-ups
- Forecast project completion times
- Estimate costs or financial outcomes
- Assess process performance
- Evaluate reliability
- Compare alternative designs
- Understand the effects of input variation
- Identify the inputs contributing most to output variation
- Evaluate risk assessment
Monte Carlo simulation is powerful, but it is not a crystal ball. Its results depend on the model you create and the assumptions you make about the inputs. If an important variable is missing, a relationship is modeled incorrectly, or an input distribution does not represent reality, running more simulation trials will not correct the underlying problem. As the saying goes: garbage in, garbage out. Monte Carlo analysis is therefore most useful when paired with process knowledge and good data.
How to Run a Monte Carlo Simulation Step by Step
If you're wondering how to do a Monte Carlo simulation, the basic process is fairly straightforward. The quality of the result, however, depends heavily on the quality of the model and the assumptions used to build it.
1. Define the Output
Begin by identifying the result you want to understand.
This might be:
- Total cost
- Cycle time
- Product dimension
- Yield
- Profit
- Project completion date
- Process output
- Probability of failure
Be as specific as possible about the question the simulation should answer.
2. Build the Model
Next, define the mathematical relationship between the inputs and output. The model should be specific to your application. A couple of examples include:
- For a simple tolerance analysis: Assembly Length = Part A + Part B + Part C
- For a financial model: Profit = Revenue – Fixed Costs – Variable Costs
The model can be simple or quite complex. What matters is that it reasonably represents the process or system being studied.
3. Identify the Inputs That Vary
Determine which inputs are uncertain. Some values may be known and can remain fixed. Others vary and should be represented with probability distributions. For each uncertain input, consider what you know about its:
- Average or most likely value
- Variation
- Minimum and maximum
- Distribution shape
Historical process data are particularly valuable because they can help determine how an input actually behaves rather than relying solely on assumptions.
4. Assign Probability Distributions
Select a probability distribution that appropriately represents each uncertain input. Depending on the situation, this could include a number of distributions such as normal, uniform, triangular, lognormal, Weibull, Binomial, or Poisson.
Distribution selection matters. A Monte Carlo simulation can generate very precise answers to a poorly constructed model, so the assumptions behind the model should always be considered when interpreting the results.
5. Run the Simulation
The Monte Carlo simulation tool randomly samples a value for each uncertain input and calculates the resulting output. That represents one trial. The process is then repeated hundreds or thousands of times. Modern Monte Carlo simulation software makes it possible to perform these calculations almost instantly.
6. Analyze the Results
Once the trials are complete, examine the resulting distribution. Depending on the original question, you might evaluate any number of things including but not limited to:
- Mean or median outcome
- Standard deviation
- Percentiles
- Minimum and maximum results
- Probability of exceeding a limit
- Probability of meeting a target
- Probability of falling outside specification
This is where Monte Carlo simulation becomes particularly useful. You have moved from a single prediction to a range of possible outcomes and an estimate of their likelihood.
7. Identify the Important Inputs
In many applications, the next question is not simply, "What is the risk?" but, "What is driving the risk?" Sensitivity analysis can help identify which uncertain inputs have the greatest influence on the output. Improvement efforts can then focus on the factors where reducing variation or changing the average will have the greatest effect.
Monte Carlo Simulation Example
Consider an assembly made from three components. The final assembly must be between 29.5 mm and 30.5 mm.
The three component dimensions have the following characteristics with normal distributions:
| Component | Average | Standard Deviation |
|---|---|---|
| Component: Part A | Average: 10.0 mm | Standard Deviation: 0.10 mm |
| Component: Part B | Average: 12.0 mm | Standard Deviation: 0.15 mm |
| Component: Part C | Average: 8.0 mm | Standard Deviation: 0.12 mm |
Adding the averages gives an expected assembly dimension of: 10 + 12 + 8 = 30 mm
However, actual parts may vary. So while everything looks perfect based only on the averages, the resulted assembly dimension could be out of specification limits a portion of the time.
A Monte Carlo simulation can randomly generate dimensions for Parts A, B, and C based on their respective distributions and add them together. Repeating this process thousands of times creates a distribution representing the expected variation in the completed assembly.
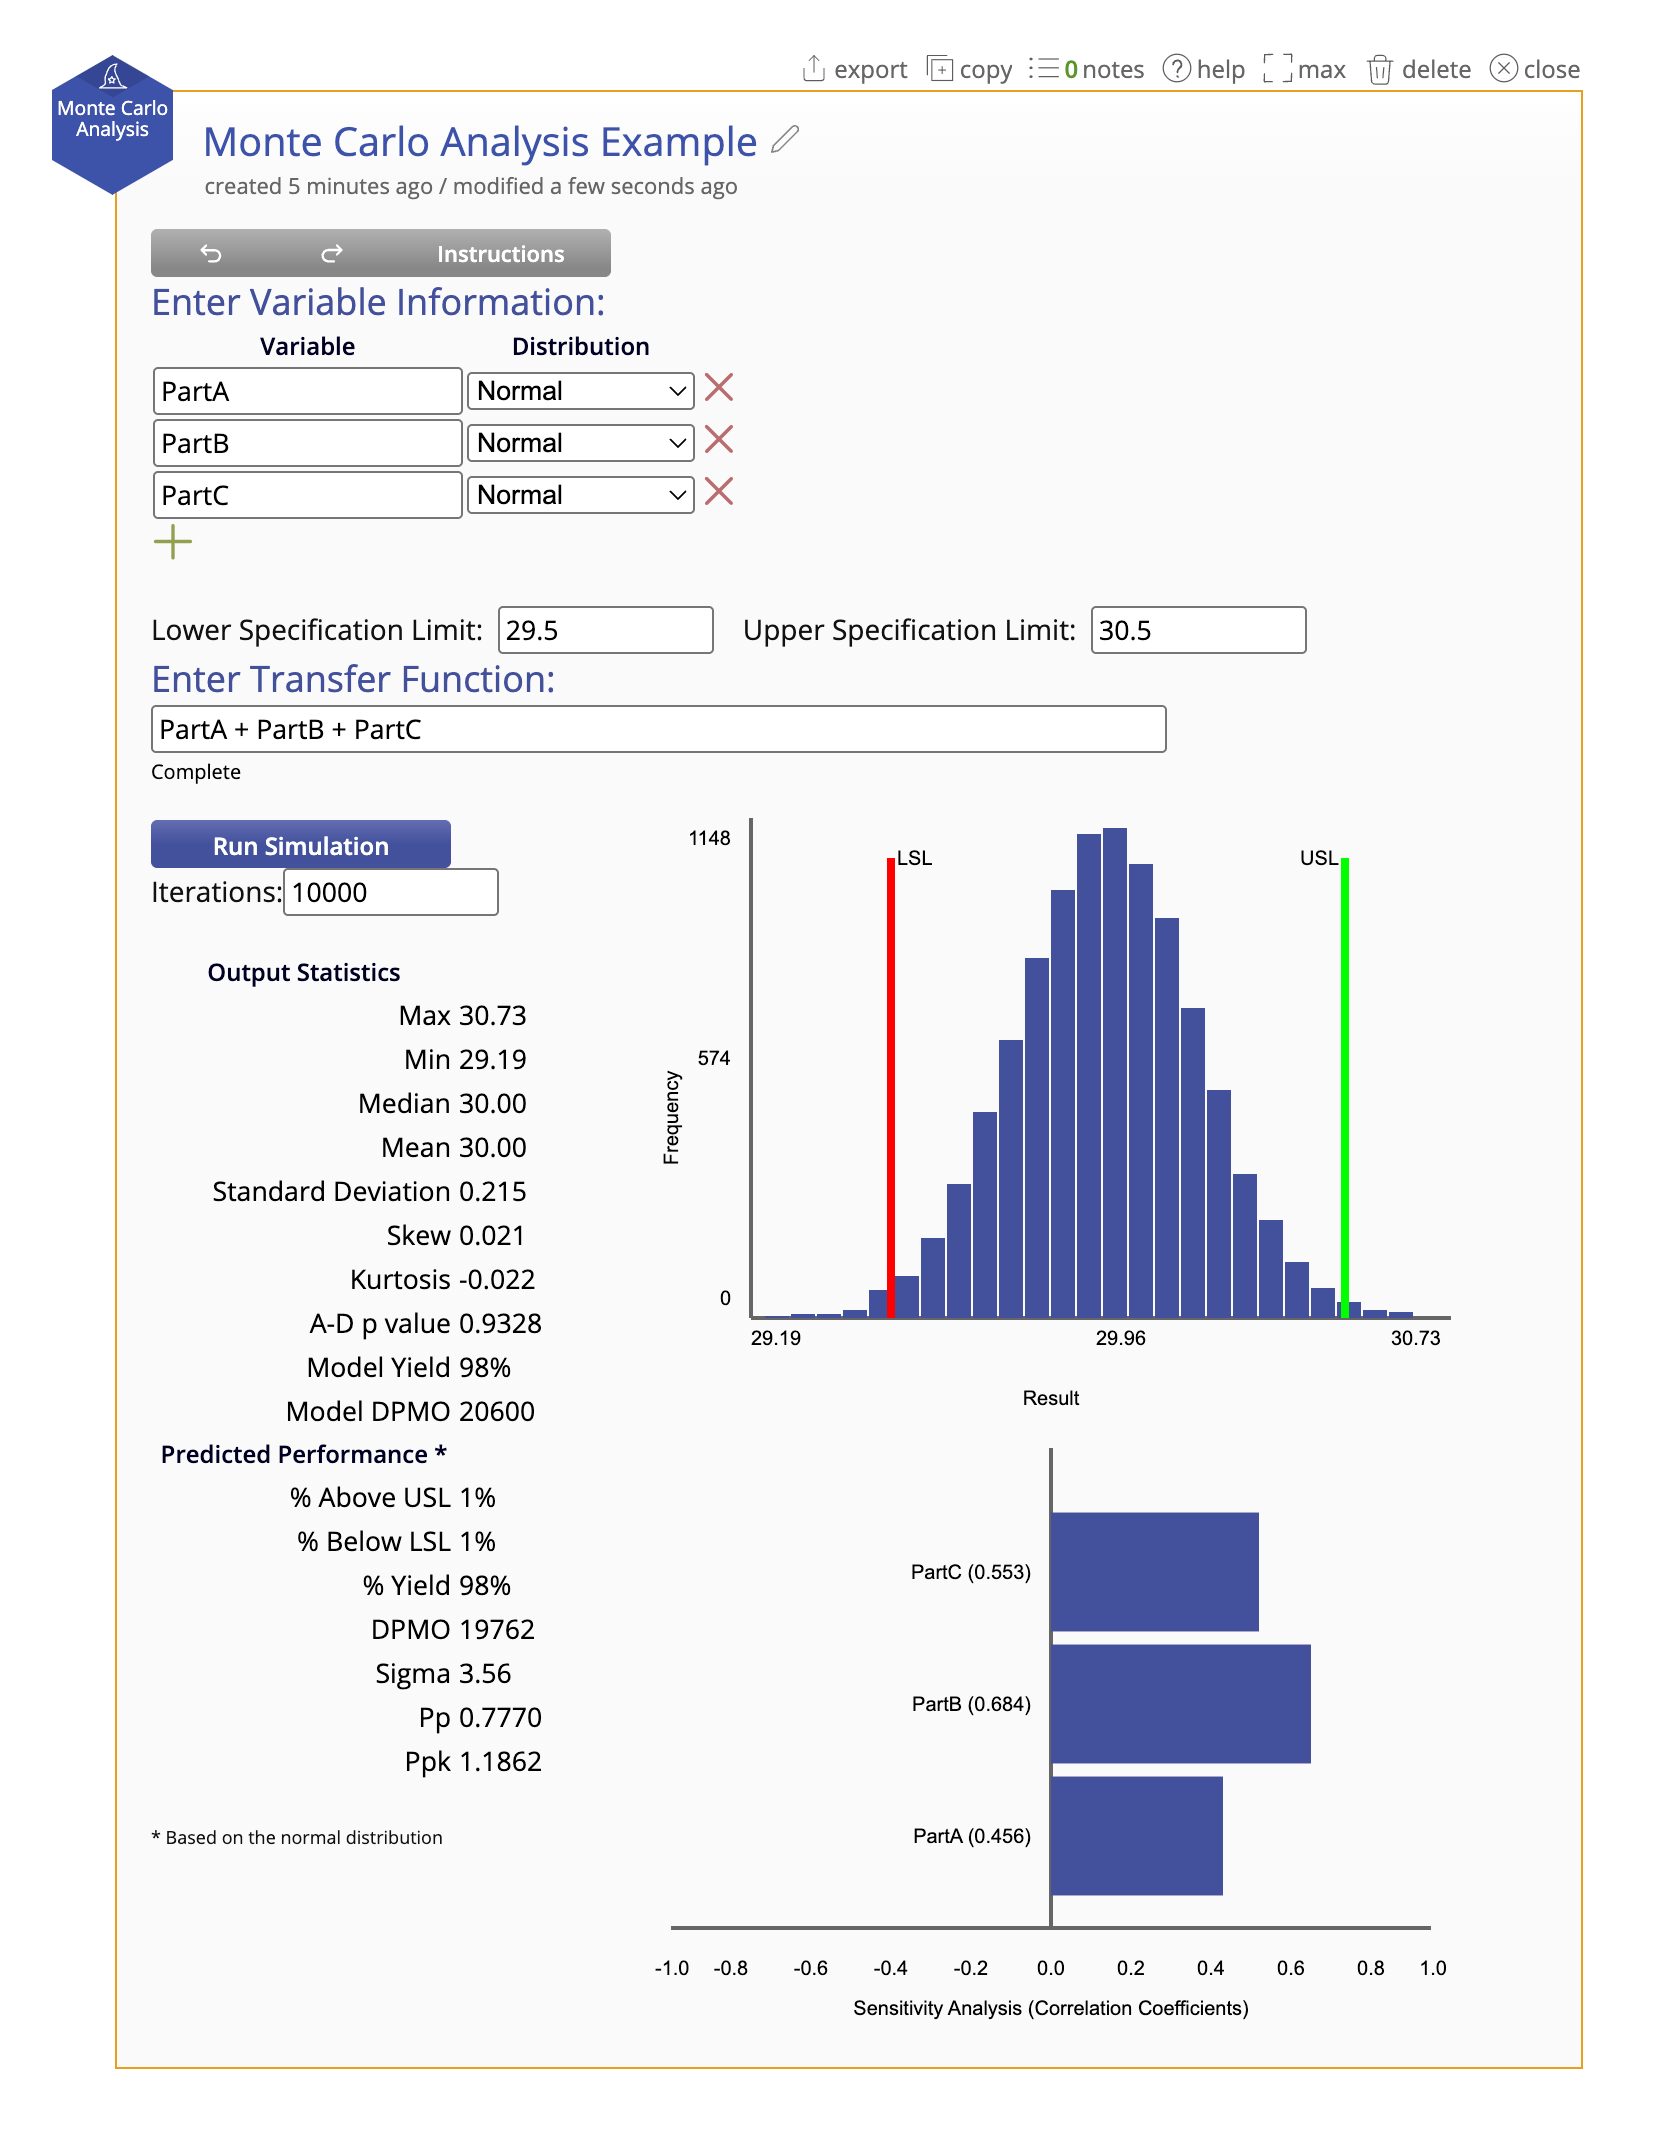
Now the engineering team can answer much more useful questions like:
- What percentage of assemblies are expected to fall between 29.5 and 30.5 mm?
- How likely is an assembly to exceed the upper specification?
- Which component contributes the most variation to the final dimension?
- How much would the defect rate improve if the variation in Part B were reduced?
For more examples of Monte Carlo simulation in action, read Statistics and Simulations, which follows a fast-food team using Monte Carlo analysis to identify the largest sources of variation in drive-through wait time and evaluate a proposed improvement before piloting it. You can also watch our Modeling Risk with Confidence Using Monte Carlo Simulation webinar for a hands-on look at setting up simulations, interpreting the results, and using them to make better decisions.
Monte Carlo Simulation for Risk Assessment
Risk often involves two questions: What could happen? and How likely is it to happen? Traditional risk assessments may identify potential outcomes but rely on subjective categories such as low, medium, and high to describe likelihood. Monte Carlo simulation can provide a more quantitative approach when the underlying uncertainty can be modeled.
For example, a project team might use Monte Carlo risk analysis to estimate:
- The probability of finishing a project before a deadline
- The likelihood that total project cost exceeds the budget
- The probability that demand exceeds available capacity
- The chance that a product dimension falls outside specification
Instead of saying a deadline is "probably achievable," the analysis might show an estimated 63% probability of completing the project by that date. This does not eliminate uncertainty. It makes the uncertainty easier to see and discuss.
Monte Carlo Simulation Software
It is possible to build Monte Carlo simulations in spreadsheets, write a Monte Carlo simulation in Python, use a dedicated Monte Carlo calculator, or leverage a statistical analysis package. The right Monte Carlo software can make the process considerably easier, particularly when a model contains several uncertain inputs or when you want to conduct sensitivity analysis.
When selecting Monte Carlo simulation software, look for the ability to:
- Define multiple input distributions
- Create or enter equations describing the model
- Run a large number of trials
- Visualize the resulting output distribution
- Calculate probabilities and percentiles
- Compare output against specifications or targets
- Evaluate which inputs have the greatest effect on the output
Whether using desktop statistical software or an online Monte Carlo simulation package, the most important part remains the same: the model and its assumptions must reasonably represent the process.
Monte Carlo Simulation in EngineRoom
EngineRoom® includes a Monte Carlo simulation tool designed for process improvement and engineering applications. Rather than requiring users to program a simulation from scratch, EngineRoom provides a visual environment for defining input distributions, constructing the model, running simulations, and evaluating the results. This can be particularly useful when teams want to evaluate process or product performance under variation without building custom Monte Carlo simulation Python code or complicated spreadsheet models.
Monte Carlo simulation can also complement other statistical tools. Data analysis can help characterize the distributions of process inputs, regression or designed experiments can help establish relationships between inputs and outputs, and Monte Carlo modeling can then use those relationships to explore how the process is likely to perform across a range of conditions.
Summary
Monte Carlo simulation is a statistical method for understanding uncertainty by repeatedly calculating a model using randomly generated input values. Instead of producing a single estimate, it generates a distribution of possible outcomes and shows how likely those outcomes are.
The basic Monte Carlo simulation step-by-step process is to:
- Define the output of interest.
- Build a model connecting inputs to the output.
- Identify uncertain inputs.
- Assign appropriate probability distributions.
- Run many simulated trials.
- Analyze the resulting distribution.
- Identify which inputs have the greatest effect on the result.
Monte Carlo modeling can be applied to engineering, manufacturing, project management, financial analysis, process improvement, and many other situations involving uncertainty. The real advantage of the Monte Carlo method is not that it predicts exactly what will happen. It gives you a better understanding of what could happen, how likely it is, and which sources of uncertainty matter most.
Related Tools & Content
- Design of Experiments (DOE)
- Regression Analysis
- Process Capability Index
- Statistical Process Control (SPC)
- Distribution Identification
- Process Capability Analysis Tool
- Sensitivity Analysis
References
Owen, Art B. Monte Carlo Theory, Methods and Examples. 2013.